Results
Evidence, not instinct.
Built with Dutch operators. Validated on active expansion decisions.
How it works
Same address. Different category. Different answer.
F&B is oversupplied on this street. L&E is whitespace. Same address, 32-point gap.
On a street that is nearly half fashion stores, Home & Living has zero same-street competitors.
Permit fit is checked instantly. Operators know in seconds — not after weeks of due diligence.
CASE STUDIES WITH DUTCH OPERATORS
Tested on decisions already in motion.

Street-level scoring for a live retail district.
- 30-point affordability gap between two adjacent streets — invisible without structured scoring
- Same listing scores 81% for one category and 49% for another — business category choice drives the outcome
- Permit fit surfaced instantly across every vacant unit, before any lease conversation begins
Every vacant unit in the district now carries a category score before tenant matching begins.
Read the full case study: the boutique fitness gap in ZaandamFor property owners and retail districts: location intelligence for commercial real estate
Prime footfall, wrong category — the data said so first.
- The highest-footfall street in the city scores below 50% for Fashion — 76 same-category competitors pull the street fit down
- The same street scores above 85% for Sports & Fitness — the thinnest supply category in the city
- Permit fit is checked across all vacants in one pass — operators know what's viable before they visit
Multi-location fashion retail operator · Netherlands · Pilot done in Q2 2026
Two listings, same rent, same city. 17-point gap.
- Korte Brugstraat scores 83% for Fashion — zero same-category competitors, strong street fit
- Halstraat scores 66% for the same category — five competitors and a denser tenant mix erode the score
- The intuitive pick and the analytical pick are different streets. Shareloc shows you why.
Restaurant chain · Netherlands · Pilot done in Q2 2026
Shortlist of two. One clear answer — once the ecosystem and growth picture came into view.
- Operator had shortlisted two locations in the same city using area-level tools. Both looked viable on the surface.
- Address-level scoring mapped catchment demographics, accessibility, competition pressure, and neighbourhood growth pipeline for each address — signals area-level tools do not reach.
- Location B scored 6.8 points higher — not because of footfall, but because of demographic precision (target women aged 20–40 within cycling distance), a 30-min free parking zone vs. paid parking only, and a growth pipeline score of 96.3 vs. 50.3 — driven by a 333-unit residential development adjacent to the site.
- The ecosystem and growth trajectory changed the picture. The intuitively stronger location was not the analytically stronger one.
- Operator used the output to align internal stakeholders and defend the final location choice.
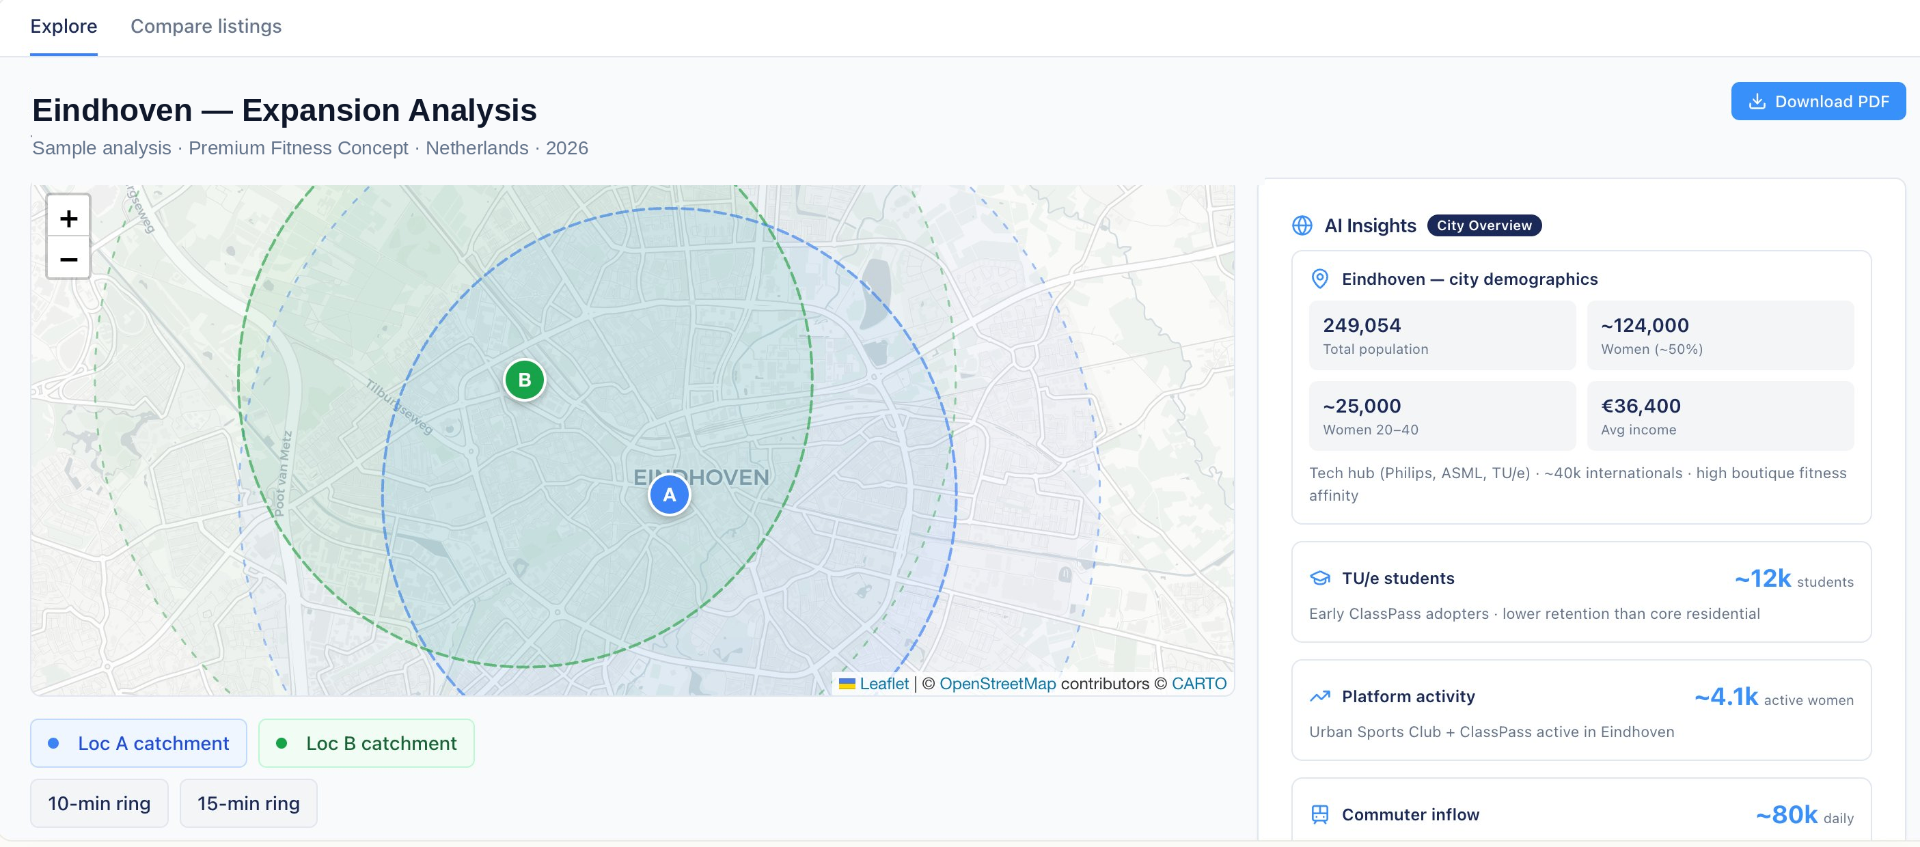
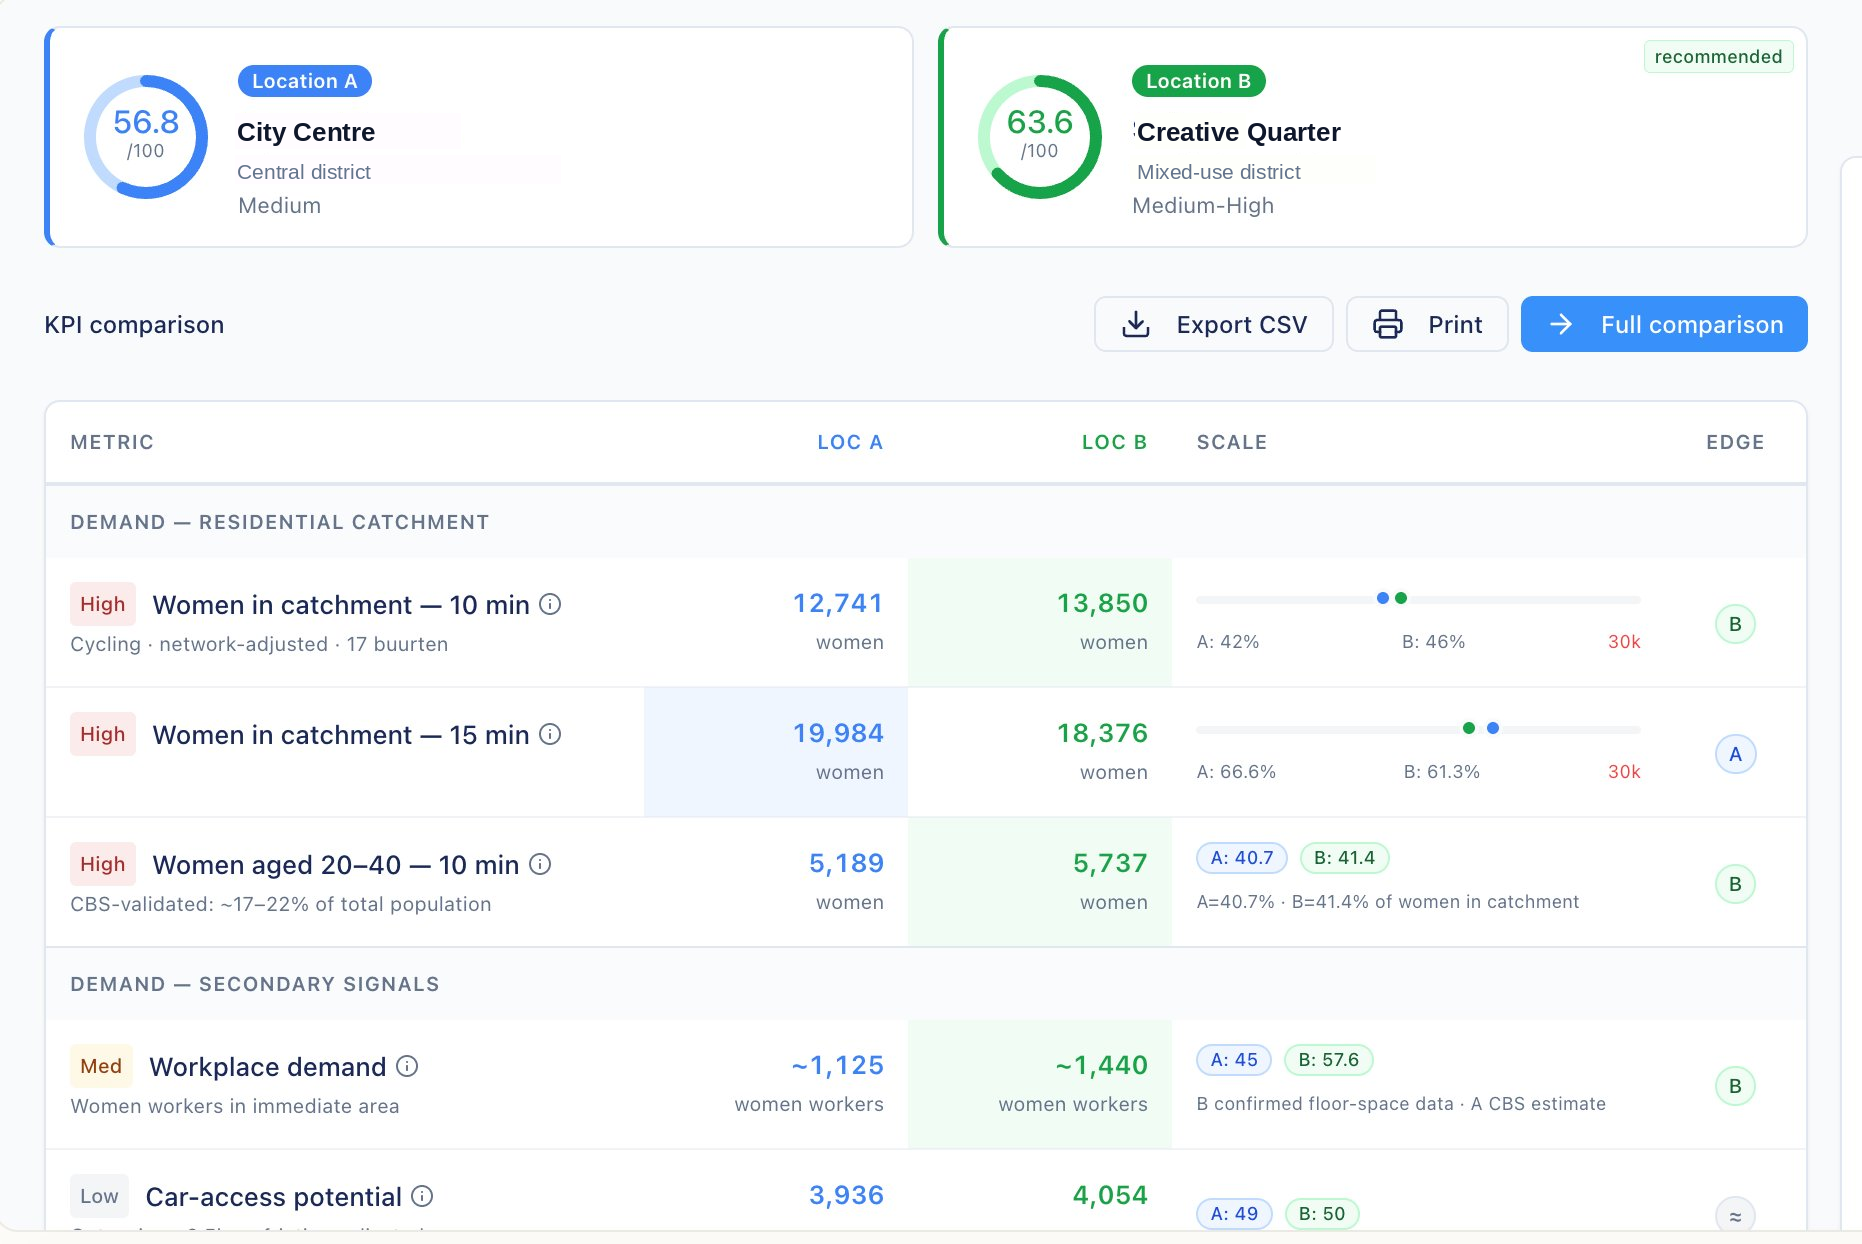
Premium fitness operator · Netherlands · Custom project · 2026
See your own market before you decide anything.
We analyse a location you are actually considering and walk you through the output. You see exactly what the platform delivers before any commitment.
One location. Twenty minutes.
Trusted by





What operators told us
Fifty interviews. One consistent message.
The gap is always at the final step — comparing specific locations within the same area. That's currently done manually. You sit in front of the site and observe.
Saints & Stars · NL / Europe
Our location research takes around eight weeks — manual, agent-dependent, and hard to validate.
H-Hospitality · EMEA
We've closed restaurants with solid customer numbers. A busy location isn't enough — rent, permits, and competition all have to align.
Walk to Wok · Amsterdam
There's no centralised data. You rely on intuition, what agents tell you, and what you see on the street.
JH Bouprojecten · Netherlands
The data is scattered and difficult to gather. A unified platform would reduce manual work and improve accuracy before you commit.
Koffiezaak · Zaandam
Where we are
Validated. Scaling.
National coverage is live. Score any retail address in the Netherlands, at the address level. Pilots running and operators making expansion decisions with Shareloc today.
Deeper data layers rolling out nationwide - footfall, catchment and permit intelligence extending to every city as coverage matures.
International expansion to follow - the United Kingdom, Belgium, Germany, and beyond. Same problem, same playbook.
Built alongside the operators who use it. Validated on live locations, active shortlists, and expansion decisions across the Netherlands.
Ready to make your next location decision with data?
Talk to us. No commitment required.
Or write to us at hello@shareloc.io
We use analytics cookies to understand how visitors use our site. No analytics will load unless you accept. See our Privacy Policy.