The headline number for Dutch retail looks almost calm. National retail vacancy sits around 5.6%. Stop there and you would conclude the market is stable and broadly healthy.
But no location decision is ever made at the national level. It is made on one specific street, for one specific unit. And that is exactly where the average stops being useful.
The market isn't failing evenly. It's concentrating.
The clearest trend in Dutch retail right now is not decline. It is divergence.
Savills reports the gap between prime and secondary retail widening through 2026, with institutional capital unwilling to move toward secondary high streets without a data-led repositioning story. CBRE recorded €4.1 billion invested in Dutch commercial real estate in Q1 2026, up 65% year on year, with capital concentrating on prime assets that have proven footfall.
You can watch it happen at brand level. De Bijenkorf reported an 8.3% like-for-like sales decline in 2025 and responded by committing €36.1 million to renovating its Amsterdam and Rotterdam flagships. It is not retreating from physical retail. It is concentrating into the locations that still command footfall. At the other end of the market, Zeeman is closing 127 underperforming European stores by 2028, most of them on secondary streets.
Same market. Two opposite moves. The difference between them is location quality, measured unit by unit.
Failure is a street-level event
Here is the part the national figure hides: the variance between two adjacent streets is often larger than the variance between two cities.
In our work with BIZ Stadshart Zaandam, we scored every vacant unit in the central shopping district. Two adjacent streets, a few hundred metres apart, showed a 30-point affordability gap. Street capture diverged 42% versus 31% across neighbouring frontages. From the pavement, they looked like the same decision. In the numbers, they were not close.
That is the pattern behind most failed locations. Not a bad city. A bad unit, on a street that looked fine.
The same address can be a winner and a write-off
Location quality is not even a fixed property of the address. It depends on what you intend to do there.
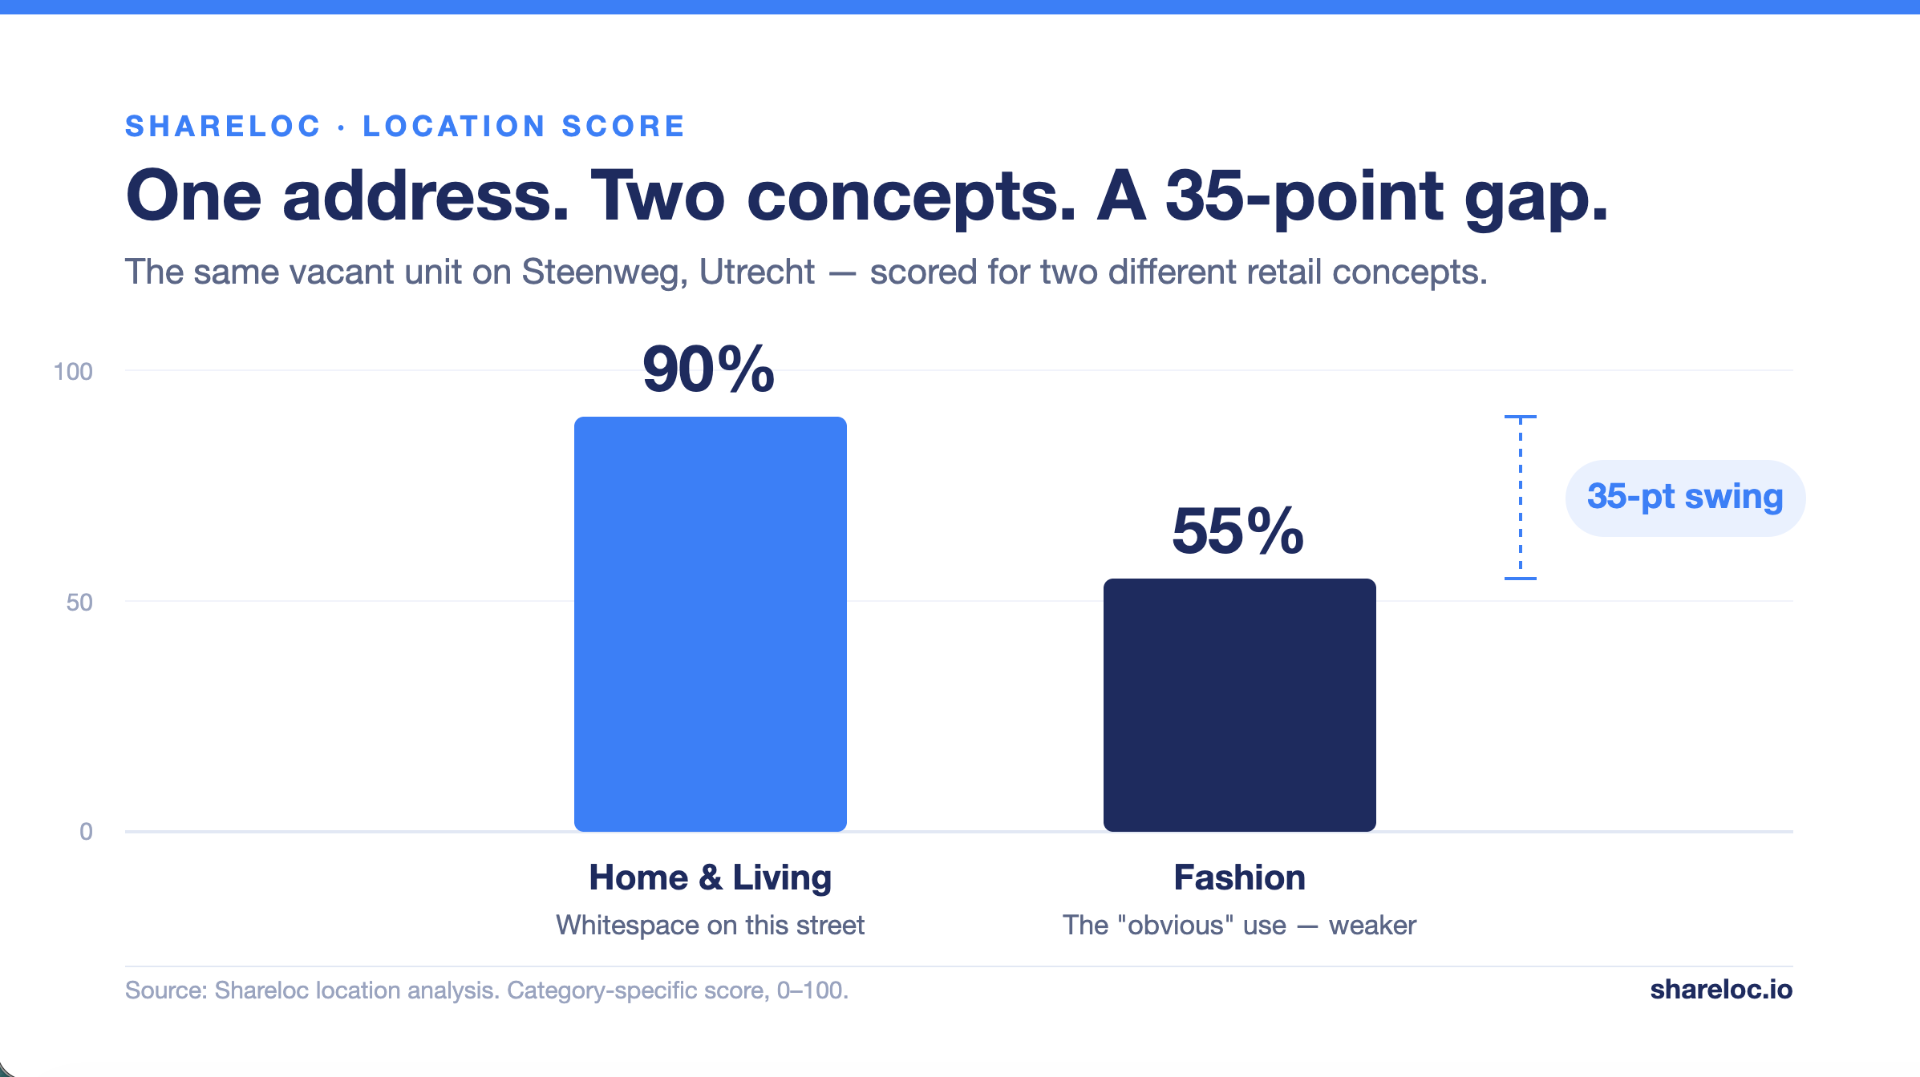
Across the cities we work in, we found repeated swings on a single address, depending on the business category:
- On Utrecht's Steenweg, one unit scored 90% for Home & Living and 55% for Fashion. A 35-point swing on the same door, on a street that is mostly fashion.
- In Zaandam, a 32-point swing between Leisure and Food & Beverage on one frontage.
- On a prime Haarlem retail street, a 75-point swing, driven entirely by permits.
Permits are the sharpest example of why a complete view matters. A zoning class can hard-gate a business category outright: several units we analysed returned a flat 0% for food and beverage because the permit simply did not allow it, regardless of how strong the footfall was. No serious operator signs a lease without checking the permit eventually. The problem is that checking is slow, manual, and done one unit at a time, usually late in the process, after a shortlist has already formed around footfall and frontage. By then the comparison has been built on the wrong basis. Surfacing permit fit instantly, across every unit on the shortlist at once, lets you eliminate the non-viable options first and compare what is left on a complete picture, rather than learning the constraint at the end.
Why capable teams still get it wrong
None of this happens because expansion teams are careless. It happens because the tooling underneath the decision has not matched the size of the decision.
The typical inputs are a broker recommendation, a site visit, and a footfall estimate from a report written months earlier. A broker's incentive is the transaction, not your five-year unit economics. National market reports describe the country, not the corner. So the most confident voice in the room wins, the lease gets signed, and three years later you find out whether it worked.
The confidence in the room is rarely proportional to the quality of the data behind it.
What actually changes the odds
A location decision improves the moment you can see the full picture for the actual unit, before you commit: footfall relative to rent, permit fit as a hard gate, the real category gap on the street, tenant-mix fit, and whether the catchment matches your customer, all on the same basis, for every option on the shortlist at once.
That is the decision layer Shareloc provides. Scoring and comparing specific addresses is the entry point, not the whole of it. The same engine surfaces the category gaps on a street: the under-served categories and openings that a list of available units would never reveal on its own. Next, we are extending the layer to track how districts change over time, including urban development, footfall shifts, and growth trajectories, so a decision accounts for where a location is heading, not only where it stands today.
Across the cities and districts we work in, every unit we analyse carries a viability score, the category gaps around it, and a direct comparison against the alternatives, before anyone signs anything. The Dutch retail market is not uniformly failing. It is sorting itself into locations that earn their rent and locations that do not. The teams that can see that difference at the unit level, and act on it before they commit, are the ones who stay on the right side of the line.
Umut Aykut Celik
Co-Founder, Shareloc
Share this article


Keep reading
Want the framework behind the score? Read The 7-Factor Framework for Choosing a Retail Location.
We'll score one of your shortlisted units with you.
Sources
- Savills NL — Dutch Retail Vacancy Report, 2026
- CBRE Netherlands — Q1 2026 Commercial Real Estate Investment Update
- RetailDetail / Financieele Dagblad — De Bijenkorf financial results, 2025
- Zeeman — European store closure announcement, 2025–2028
- Shareloc — First-party location analysis data, pilot cities Netherlands (Zaandam, Utrecht, Haarlem), 2025–2026